Scraping National Food Price Data from Indonesia's Official Portal
📌 Project Overview
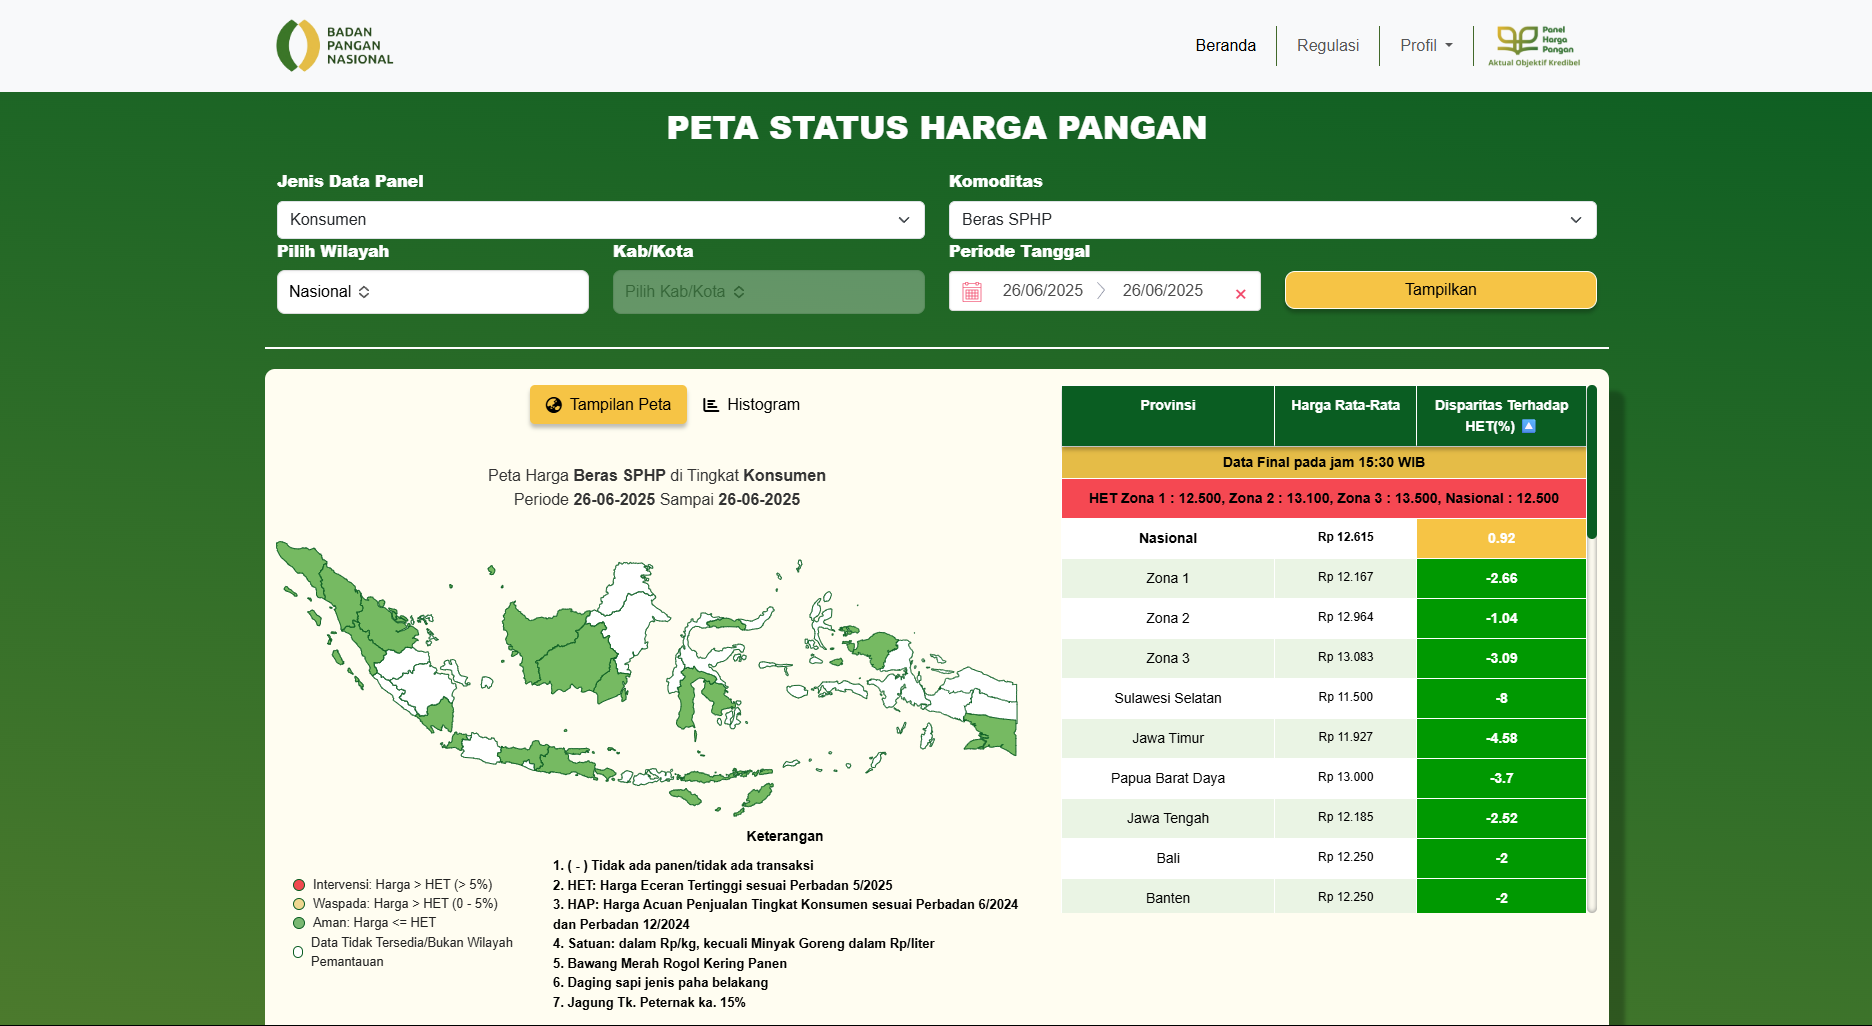
As part of our data-driven food price forecasting initiative, I developed a robust automated scraper to collect daily food price data (specifically, premium rice) across selected Indonesian provinces. The data was sourced directly from the official government portal panelharga.badanpangan.go.id, covering a multi-year range from March 2022 to March 2025.
This project goes beyond simple data collection. It includes a comprehensive Exploratory Data Analysis (EDA) phase where we identified bimodal price distributions and classified price regimes (Low, Balanced, High) to better understand market volatility.
🔍 Objectives
- Automate daily scraping of premium rice prices across selected provinces.
- Handle dynamic elements, multiple date selections, and data formatting with Selenium.
- Collect data in a tabular format (date, province, price) for 3 years.
- Analyze price distributions using Histogram and Kernel Density Estimation (KDE).
- Classify price regimes (Low, Balanced, High) based on statistical quantiles.
- Store the results in a structured
.csvfile for further analysis.
🛠️ Tech Stack
- Language: Python
- Libraries:
Selenium– for browser automationBeautifulSoup– for DOM parsingPandas&NumPy– for data manipulationMatplotlib&SciPy– for visualization and statistical analysis (KDE)
- Browser: Brave (Chromium-based)
🌐 Target Source
- Website: https://panelharga.badanpangan.go.id
- Komoditas: Premium Rice (
value="37") - Provinces Scraped:
- Gorontalo
- Sulawesi Barat
- Sulawesi Selatan
- Sulawesi Tengah
- Sulawesi Tenggara
- Sulawesi Utara
⚙️ Key Features & Challenges
✅ Features
- Full control of datepicker navigation for daily selection across 3 years.
- Multiselect provinsi handling with dynamic scroll/click logic.
- Extraction of tabular data and cleaning of price formatting (
Rp,.). - Resilience through try/except and WebDriverWait logic for slow-loading elements.
- Final output saved as
data_harga.csv.
⚠️ Challenges Solved
- Dynamic rendering and lazy loading of tables.
- Date selection issues across multiple years with different calendar formats.
- Some provinces require scrolling into view before clicking.
- Resilient looping with date and pagination handling.
📊 Data Analysis & Insights
1. Bimodal Price Distribution
Using Kernel Density Estimation (KDE), we discovered that the price of premium rice in Sulawesi follows a bimodal distribution (two peaks), rather than a normal distribution.
- Peak 1 (Normal Regime): ~Rp 14,500 - Rp 15,500
- Peak 2 (High Regime): ~Rp 17,500 - Rp 19,500
This indicates that the market fluctuates between two distinct states: a stable “normal” price and a “high” price driven by external pressures (seasonality, supply shocks).
2. Price Regime Classification
To categorize these states, we defined three regimes based on historical quantiles:
- 🔵 Low (RENDAH): Price $\le$ Q20
- 🟢 Balanced (SEIMBANG): Q20 < Price < Q80
- 🔴 High (TINGGI): Price $\ge$ Q80
This classification allows us to visualize time series data with color-coded regimes, making it easy to spot periods of price stress.
📁 Output Sample
1
2
3
4
5
Tanggal      | Provinsi         | Harga | Rezim
-------------|------------------|-------|----------
2022-03-25   | Sulawesi Selatan | 12600 | RENDAH
2022-03-25   | Gorontalo        | 12800 | RENDAH
...
🔗 Project Repository
📁 GitHub Repository: Indonesia-Food-Price-Scraper
Complete source code, documentation, and sample datasets available in the repository.
🚀 Future Work & Enhancements
📈 Data Analysis Extensions
- Time Series Analysis: Implement seasonal decomposition and trend analysis
- Price Forecasting: Develop LSTM/ARIMA models for price prediction
- Regional Comparison: Statistical analysis of price variations across provinces
- Market Insights: Correlation analysis with external factors (weather, policy changes)
🔧 Technical Improvements
- Parallel Processing: Multi-threaded scraping for faster data collection
- Database Integration: Direct storage to PostgreSQL/MongoDB instead of CSV
- API Development: REST API for real-time price data access
- Docker Containerization: Portable deployment with consistent environments
📊 Visualization & Dashboard
- Interactive Dashboard: Real-time price monitoring with Streamlit/Dash
- Geographic Visualization: Price heatmaps across Indonesian provinces
- Alert System: Automated notifications for significant price changes
- Mobile App: Cross-platform app for price tracking
🤖 Automation & Monitoring
- Scheduled Scraping: Daily automated data collection with GitHub Actions
- Data Quality Checks: Automated validation and anomaly detection
- Error Handling: Robust retry mechanisms and failure notifications
- Performance Monitoring: Scraping success rates and response time tracking
🌐 Data Sources Expansion
- Multi-Commodity Support: Extend to vegetables, fruits, and other staples
- Cross-Platform Scraping: Integrate data from multiple government portals
- Historical Data: Backfill missing data points from archives
- Real-time Integration: WebSocket connections for live price updates
📋 Compliance & Maintenance
- Rate Limiting: Respectful scraping with appropriate delays
- Legal Compliance: Terms of service monitoring and adherence
- Documentation: Comprehensive API documentation and user guides
- Testing Framework: Unit tests and integration testing for reliability
🎯 Key Takeaways
- Selenium Mastery: Complex web automation with dynamic elements and date pickers
- Data Quality: Robust extraction and cleaning processes for reliable datasets
- Scalability: Design patterns for handling large-scale data collection
- Public Data Value: Converting government data into actionable insights for research and policy
This project demonstrates practical web scraping skills for public data collection, enabling data-driven analysis of Indonesia’s food price dynamics for economic research and policy development.